A certificate is the past
What an olive oil certificate
cannot tell you
A certificate is the past.
Once you understand this one sentence, you will choose olive oil differently.
Today we place two Italian certificates side by side and look at what a certificate can tell you and what it cannot.
What is a certificate?
An olive oil Certificate of Analysis is a snapshot of the moment the olives were milled.
Free acidity (FFA) 0.15%, peroxide value (PV) 6.2, polyphenols 536 mg/kg… These figures were measured by an accredited laboratory right after milling.
From the moment the oil is bottled, through the journey from Italy to Korea and the time it spends in a warehouse, the figures change. Some change fast, some slowly, and some hardly at all.
It does not tell you the quality at this moment.
Two certificates side by side

Italian olive oil physico-chemical analysis certificate A
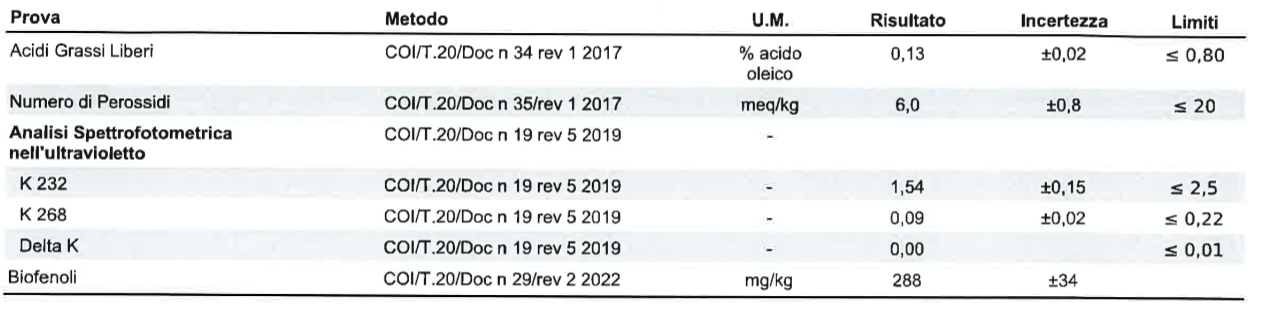
Italian olive oil physico-chemical analysis certificate B
Both oils come from Italy. Both were milled right after the November 2025 harvest and sent straight to an accredited laboratory. Both are good oils.
Yet side by side, the numbers differ.
Oil A
Oil B
IOC COI/T.20 — measured right after milling
| Parameter | IOC limit | Oil A | Oil B | Reading at milling |
|---|---|---|---|---|
| FFA Free acidity |
≤ 0.8% | 0.15% Premium |
0.13% Premium |
Both top grade. A producer indicator that barely changes after milling. |
| PV Peroxide value |
≤ 20 | 6.2 EVO IOOC |
6.0 EVO IOOC |
Excellent as measured right after milling. The PV at this moment is unknown. |
| K268 Secondary oxidation |
≤ 0.22 | 0.18 Standard EVOO |
0.09 Premium |
The biggest difference. A’s value reflects the oil at milling, not a distribution problem. Both rise over time. |
| K232 Primary oxidation |
≤ 2.50 | 1.64 EVO IOOC |
1.54 Premium |
B is slightly ahead. Both are good. A value that rises slowly. |
| Delta K Refined oil detection |
≤ 0.01 | 0.003 Premium |
0.000 Perfect |
No refined oil in either. Set at production and does not change afterwards. |
| Polyphenols Oxidation defence |
EU 250+ | 536 High polyphenol |
288 Above the threshold |
A has nearly twice as much. This is why A holds up better in distribution despite its higher K268. Decreases over time. |
All figures were measured right after milling. They are not today’s figures. This comparison does not show “which oil is better” but “what starting point each oil had”.
Reading each value
What each one tells you
FFA (free acidity) — the producer indicator
Oil A 0.15%, Oil B 0.13%. Both are at premium level. FFA barely changes after milling. It is a producer indicator that shows the producer milled good fruit quickly.
An oil that boasts 0.1% acidity can arrive in Korea with a PV of 18. An oil with 0.3% acidity can arrive with a PV of 7 thanks to flawless distribution. Which oil is better?
PV (peroxide value) — the most important figure right now
Oil A 6.2, Oil B 6.0. Measured right after milling, both are fresh.
However, the PV at this moment is unknown. PV keeps rising from the moment the oil is exposed to light, heat and air. On the way from Italy to Korea and while stored in a warehouse, it does not stop rising. The PV on the certificate is the starting point.
| PV | Meaning | Range |
|---|---|---|
| 5 or below | Freshness close to just-milled | Premium |
| 5 ~ 10 | Still fresh. Well distributed and stored | EVO IOOC competitive range |
| 10 ~ 15 | Within the EVOO limit. Freshness starting to decline | Standard EVOO |
| 15 ~ 20 | Close to the IOC limit. Storage should be checked | Caution range |
| Above 20 | Cannot be classified as EVOO | Above the IOC limit |
Oxidation proceeds in two stages.
Stage 1 → PV rises (early oxidation)
Stage 2 → PV actually falls
As oxidation goes deeper, primary oxidation products turn into aldehydes and ketones, so PV drops while K268 climbs sharply. In other words, a low PV with a high K268 means oxidation is already well advanced. PV must always be read together with K268.
How Korea’s climate
affects olive oil
In Italy, the average storage temperature is 15–18°C, the ideal range for olive oil.
Korea is different.
After one Korean summer, PV can rise to two or three times the just-milled value if the oil is not stored properly. There is no guarantee that figures on a certificate issued in the Italian climate stay the same until the oil reaches a Korean consumer. This is why distribution and storage matter even more in Korea, and why a certificate should not be trusted blindly.
Position at milling
PV × K268 quality map
Plot the two oils on a quality map and the difference in their position at milling is clear at a glance. Note that this position is based on just-milled figures — it is not where they are at this moment.
Quality ranges by olive oil peroxide value (PV) and K268
Oil B (PV 6.0 / K268 0.09 / polyphenols 288)
A framework for reading certificates
Past · Present · Future
Each item on a certificate speaks about a different point in time. Understand this, and a single certificate lets you read the whole story of an oil.
The right order for reading a certificate
B: FFA 0.13% · ΔK 0.000 · K232 1.54
★ Most important
B: 288 mg/kg
What a certificate cannot tell you
is something a certificate cannot answer.
A certificate is a record of the starting point.
Current quality can only be known by measuring PV now.
Oil A’s starting point — K268 is high, but 536 mg/kg of polyphenols holds oxidation back. It can hold up relatively better even in Korea’s extreme climate.
Oil B’s starting point — a very low K268 means high purity at the start. But with polyphenols at 288, its defence against oxidation is relatively weaker.
Neither oil is better or worse. They have starting points of a different character.
but a certificate alone does not complete it.
It is completed in distribution and storage — and in the consumer’s mouth and nose.
All the more so in a market with a climate as extreme as Korea’s.
Asia’s first globally standardized olive oil sommelier program
02-417-5135 · info@oliveacademy.co.kr